Is there global warming?
Activity 1: Time series, means and anomalies
Learning objectives:
- Building a library of analysis tools
- Introduce Time Series – a series of values archived over time
- Computing Average of a series
- Introduce the idea of anomalies – departures from average
- Trends in data – quantifying trends
- Linear regression – algorithms for computing trends
- Forecasting information in the future when the data doesn’t exist
- Climate scientists think that earth will have big problems when it surpasses 2°C warming relative to normal
- Significant weather changes
- Hard to revert back to normal
- Climate scientists think that earth will have big problems when it surpasses 2°C warming relative to normal
- Statistical significance – what are the odds that an observed trend could happen by chance
- Applying what we learned to other data sets, other time series
Introduction Activity:
This video is of Senator James Inhofe from Oklahoma; Chairman of the Arms Services Committee and author of the book: “The Greatest Hoax: How the Global Warming Conspiracy Threatens your Future” https://www.amazon.com/Greatest-Hoax-Warming-Conspiracy-Threatens/dp/1936488493
In this video he is talking on Senate floor about global warming and how “we keep hearing about how 2014 was the warmest year on record” and displays a snowball he made from outside the senate on this February day in Washington, D.C.
As an introductory activity, ask students to discuss the merits and concerns about this senators words and actions as they relate to global warming. In particular, be on the lookout for comments such as:
- “Whether there is snow and/or cold weather on a particular day is not really relevant to the average for an entire year, or the trends in temperature over decades”
- “The weather in Washington D.C. in February or any specific location may not be representative of what the entire globe is experiencing.”
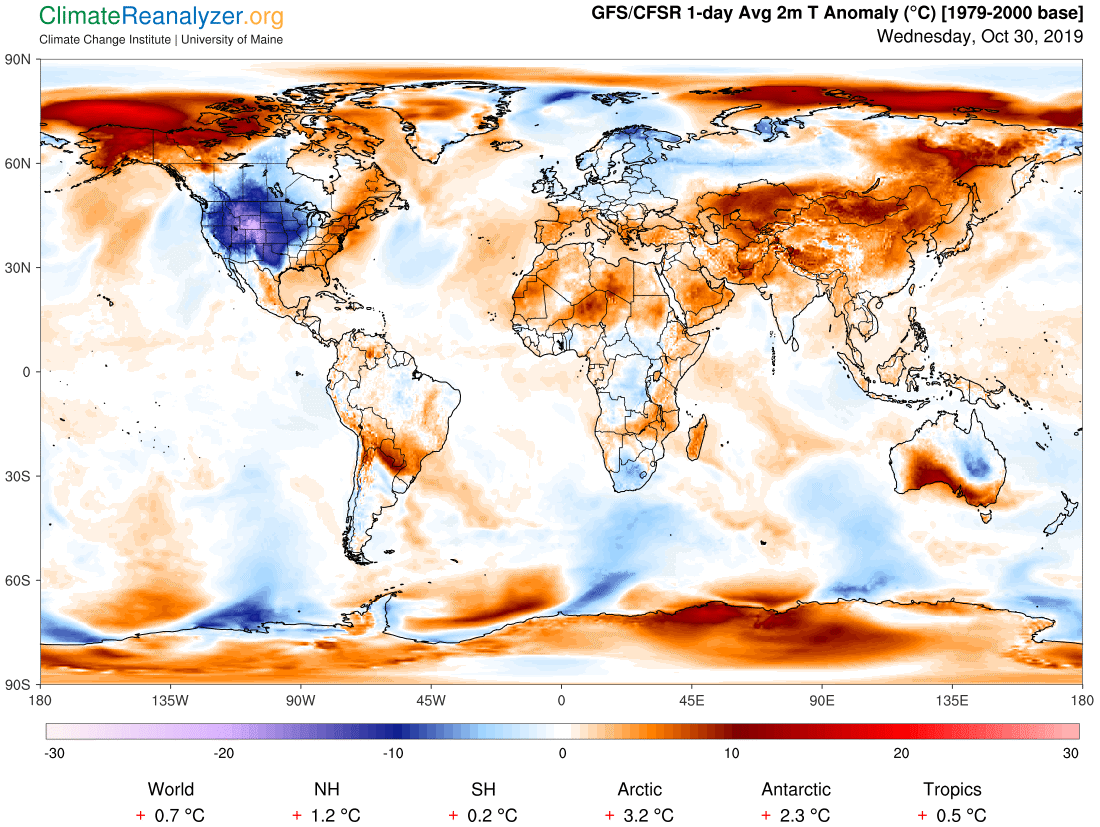
(As an example, on a day like October 30, 2019, someone located in Colorado or anywhere in the western U.S. might be experiencing very cold weather, while a large fraction of the rest of the earth is experiencing above average temperatures)
Tell students that they will be preparing their representative to testify before congress. They have a few weeks to prepare a report for them to use as a basis of their testimony. Ask students to think about what better methods they can use to prove or disprove whether temperatures on the earth have been rising for decades? Gather ideas.
If they suggest using temperature data for the whole globe, ask “Where should we get the data?”
Look for answers such as “global recognized research centers”, “international agencies”, etc. Suggest NASA as a possibility. “Would most people trust NASA to provide temperature data representative of planet earth?”
We will use NASA temperature data as a starting point with the hopes to write any analysis code flexible enough to use data from other sources. As a class, Google search: “NASA air temperature data”.
As a class, browse the top search result: https://data.giss.nasa.gov/gistemp/
Explain to the students that our analysis will consist of two parts:
- Looking at the data from a specific location, hopefully near to where we live, that goes into the entire global analysis as a way to a) determine if/how our local temperatures have changed over recent decades and b) as testing data source for developing our analysis code. We know our own temperatures best, so may be able to spot problems in our analysis more readily by using local data.
- Looking at data that NASA has created by combining all the local temperature records into an historic global temperature record. We will use these global temperatures to determine :
- whether the earth has warmed, cooled or stayed the same over recent decades
- how large are any changes we observe
- how important are any changes we observe
Explain to students that: “Our goal will be to try to create a report quantifying (assigning values to) any temperature change and providing numbers and figures demonstrating how these changes relate to the historic record of temperatures. We will do this by creating visualizations of any information we come up with in our analysis. (“A picture is worth a thousand words“)
In short, we are going to create a report to congress that we can present as evidence, that will hopefully be more useful to an important decision making body than a snowball.
Our Local Data:
In the right-hand column of the NASA GISS webpage is a link with title: Station Data
NASA station data: https://data.giss.nasa.gov/gistemp/station_data_v4_globe/
On this page, select stations to look at using the red-dotted locations on the globe map at the bottom of the page. Use the From: and To: filters to limit the locations so that the page show only those that have recorded data for at least one hundred years.
Try to find a location fairly close to your location with a good long temperature record. Stations with more than 100 years of data are preferred. Note any gaps in the records. These often come at times of global strife (e.g., WWII, etc.) when governments were preoccupied with more pressing matters than taking and preserving temperature data.
Important Note: Choose a station to analyze that has a period or two of missing data for the following activity. Including missing data drives home the point that working with data is often messy. It requires that students consider the ramifications of the missing data when they are creating their code, how the missing information is noted in the record, and how to account for, and visualize, it in any of the analyses we create.
In our first activity, we will
- Choose a representative temperature time series. (We chose Urbana, Illinois.) Look at graphs to see the whole time series.
- Note gaps, temporal coverage, periods of missing data
- Plot the data ourselves – make sure it is what we expect
- Create means of the data
- Create anomalies of the data – was a given year above normal or below normal in Urbana
- Introduce the concept of a filter for the data; Plot the 5- and 10- year running means of the data and anomalies
Note: Urbana, Illinois and Global data are provided to you in a convenient Swift array form at this link: https://buildingrainbows.com/nasa-global-temperature-anomalies/
let urbanaRaw = [ 9.53, 11.43, 11.07, 10.38, 10.47, ... ]
Introduction to Activity #1
Discuss with the class these questions: “What is an average?” “What is it used for?” “How do we compute an average?”
Activity 1a: Using the ‘Answers’ template in Swift Playgrounds, write a Swift function to compute an average of a series of data
We did this as a class using the ‘Answers’ template in Swift Playgrounds and came up with the following:
public func average(inputData: [Double]) -> Double {
     var count = 0.0
     var sum = 0.0
     for value in inputData {
        sum += value
        count += 1.0
     }

     return sum / count
 }
We used this as an opportunity to introduce the for value in inputData { } form of a loop, which is useful if one needs to iterate over an entire loop. In the loop, there is no index created. Instead a variable (in this case ‘value’) is created during each iteration of the loop and can be used in any computations within the loop block.
When we called our function using:
let urbanaAverage = average(inputData: urbanaRaw)
show(“The average temperature for Urbana is \(urbanaAverage)”)
We came up with an answer of about 33°C.
Students compared the answer to what they thought should be the average in a ‘sanity check’. The eyeball approach suggested an average of 11°C instead of the 33°C. Something is wrong. Students quickly identified that the 999.9 values indicating temperatures that were ‘missing’ was fouling up their computation of the average biasing the computed result artificially high.
We worked as a team to refactor our function to account for missing values. We also made it ‘generic’ in case we used a different dataset someday that used a different value to indicate missing data. The result was:
public func average(inputData: [Double], missingValue: Double) -> Double {
    var count = 0.0
    var sum = 0.0
    for value in inputData {
        if value != missingValue {
             sum += value
             count += 1.0
         }
     }
     return sum / count
 }
The new result was a much more sane : 10.9°C.
As a final test for this function, ask the students to input an empty array into their function call:
let testAverage = average(inputData: [Double]())
show(“The average temperature for Test is \(testAverage)”)
The results is a program crash. Ask the students to step through the code and determine why this happened? Divide by zero! (Since the count variable remains at zero in the function). Again, more refactoring to get:
public func average(inputData: [Double], missingValue: Double) -> Double {
     var count = 0.0
     var sum = 0.0
     for value in inputData {
         if value != missingValue {
             sum += value
             count += 1.0
         }
     }
     if count == 0.0 {
          return 999.9
     }
     return sum / count
 }
This is the solution we agreed upon, but it is definitely not a great solution. If your students have learned about optionals, then returning an Optional Double = nil when an average cannot be computed is definitely a better solution. For us, returning a ‘special value’ like 999.9 as in the above works fine for now. If you are interested, a solution returning an Optional Double would be:
public func average(inputData: [Double], missingValue: Double) -> Double? {
     var count = 0.0
     var sum = 0.0
     for value in inputData {
         if value != missingValue {
             sum += value
             count += 1.0
         }
     }
     if count == 0.0 {
          return nil
     }
     return sum / count
 }
Activity 1b: Creating a time series of anomalies
Questions: In the previous activity, we computed the ‘long-term-average’ of the air temperature time series.
“What would be the best way to determine how an individual year compares to its long-term average?”
Discussion: Introduce the idea of an anomaly. An anomaly is just a departure from ‘normal’ or average. An anomaly can be positive if the value is above the long-term average, or negative if the value is below the long-term average. For example, a 1994 temperature of 9.8°C is +1.4°C above the long-term mean, where the mean for the series is 8.4°C. We say that 1994 had an anomaly of positive 1.4°C.
Ask students: “What is the expression for computing an anomaly then?” Answer: (temperatureValue at some time – longTermMean).
Discuss with students a step-by-step algorithm for computing a series of anomalies from the data. Create a function that will take an array of Doubles (raw temperatures) and return an array of Doubles (temperature anomalies) with the same number of elements. Remind the students of the issue with missing values. Ideally, we would like to preserve the missing values in the anomaly series (I.e., if the actual value is missing, the anomaly should be represented as a missing value, because it cannot be computed.).
Students should work in teams of 2-3 to create a function that returns an array of anomalies.
Go over the solution together. Something like the following will work, but there are many possible solutions:
public func createAnomalies(from input: [Double], withMissingValue missingValue: Double) -> [Double] {
     // This solution creates an array of doubles that is the same size as the input series,
     // all elements set to missing values
     var anomalies = [Double](repeating: 999.9, count: input.count)
     let seriesAverage = average(inputData: input, missingValue: missingValue)
     for index in 0 ..< input.count {
         // only if the temperature data is not missing will we replace the 999.9 with the
         // departure from the mean
         if input[index] != missingValue {
             anomalies[index] = urbanaRaw[index] - seriesAverage
         }
     }
     return anomalies
 }
Summary Activity: Review the idea of a mean and an anomaly as a departure from a mean. Have a short discussion and ask any volunteers to discuss the following:
“How are you personally an anomaly? In what ways are you different than the ‘norm’.”
Homework Ideas for Section #1: Testifying before congress: Part 1: Building a case
- What fraction of the first half of the local temperature record are above average?
- What fraction of the second half of the local temperature record are above average?
- How does the average of the first half of the record compare to the average of the second half of the record? Is the first half of the record warmer than the second half, or cooler? By how much? Note: Remember to create a new array of Doubles use: let firstHalf = [Double](). To append to an array: firstHalf.append(urbanaRaw[I]).
Part 2 of this Swift Data Science series of lessons: Building a case